The unified architecture
One operating layer. Every plant. Every vendor. Every stakeholder.
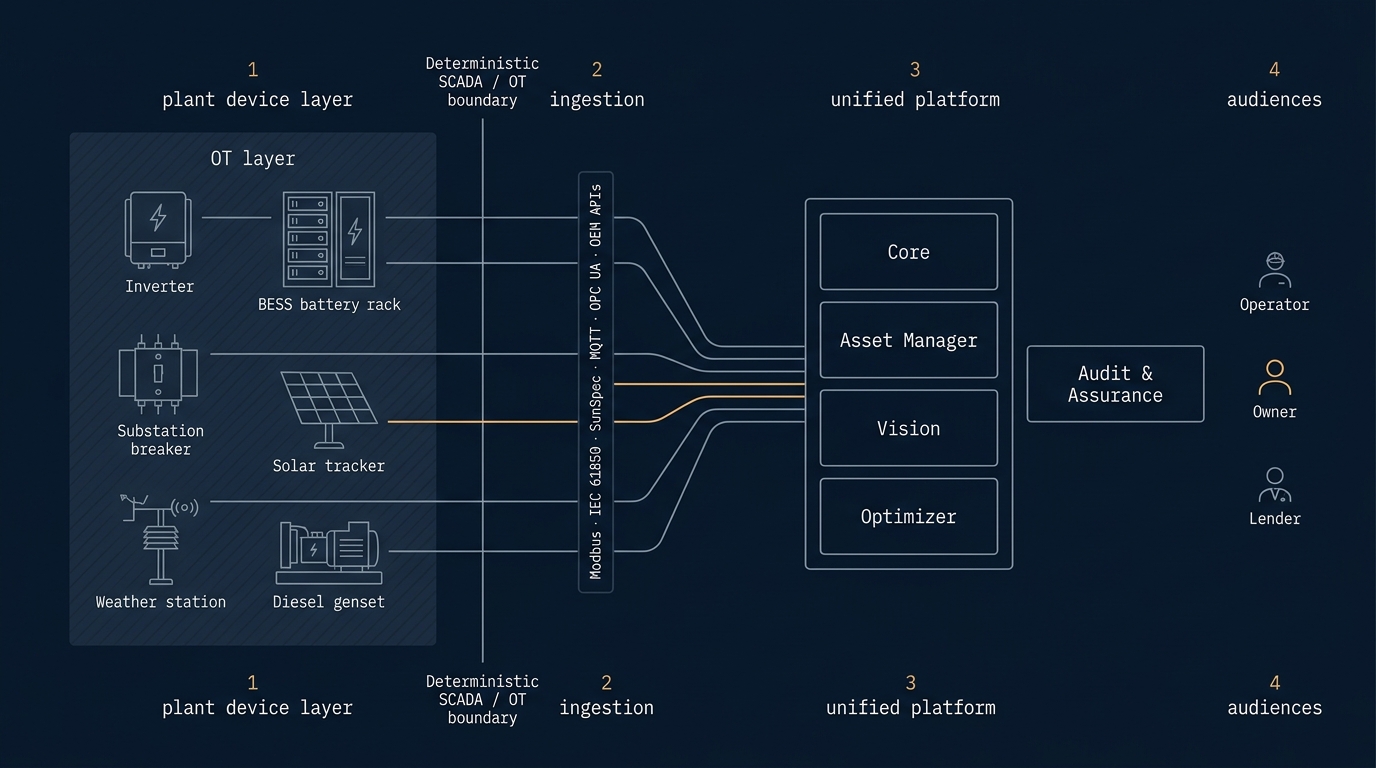
SCADA, maintenance workflow, performance analytics, and hybrid EMS — all reading the same plant, on one tenant hierarchy and one data model. So when the operator opens an alarm, the asset manager opens a KPI, and the lender opens an evidence pack, they're looking at the same source. LumeTrax® activates module by module on that one foundation.
Why the platform exists in this exact shape
Four gaps the renewable software market hasn't closed.
Renewable operating tools cluster into one of three buckets: full-stack monitoring suites, industrial-control majors, or narrow specialists. Each bucket leaves the same four gaps open. LumeTrax was built specifically to close them — that's the whole point.
Cross-tech hybrid reality
Most monitoring platforms were built for single-technology portfolios — PV-only, or wind-only, or BESS-only. Real-world utility-scale portfolios increasingly run hybrid PV + BESS + DG, often on weak grids, often under tariff structures most platforms weren't designed against. The platforms that handle that shape are rare.
Power-plant-native maintenance workflow
Generic CMMS tools were built for factories — repeating production lines, fixed BOMs, predictable failure modes. A 50 MWp plant doesn't fail like a factory. Renewable specialists either don't ship a workflow layer at all, or ship a thin work-order tracker that doesn't close the loop on alarm → ticket → resolution → evidence.
Financial-grade operational evidence in the platform
Bankability and technical assurance still typically live outside the operating software — in spreadsheets, PDFs, and quarterly compilations. The operating system shows kWh and alarms; the lender pack shows availability decomposed by attribution and PR vs. expected. Connecting the two takes weeks of human reconciliation. We built the connection in.
Supervisory control depth, not a reporting layer
Many renewable platforms sit above OEM portals as a reporting layer — they read what the OEM exposes and render it. The actual SCADA — supervisory control, alarm philosophy, control authority matrix, deterministic OT boundary — is still on the OEM stack. LumeTrax Core is the SCADA layer itself, with control authority and an industrial-grade boundary.
The architectural decisions that follow — one tenant, one data model, one alarm philosophy, one set of finance-grade definitions — are downstream consequences of choosing to close those four gaps in one platform rather than four.
One tenant hierarchy
The same model on screen one and screen one-thousand-and-one.
Every screen, every report, every API call uses the same hierarchy.
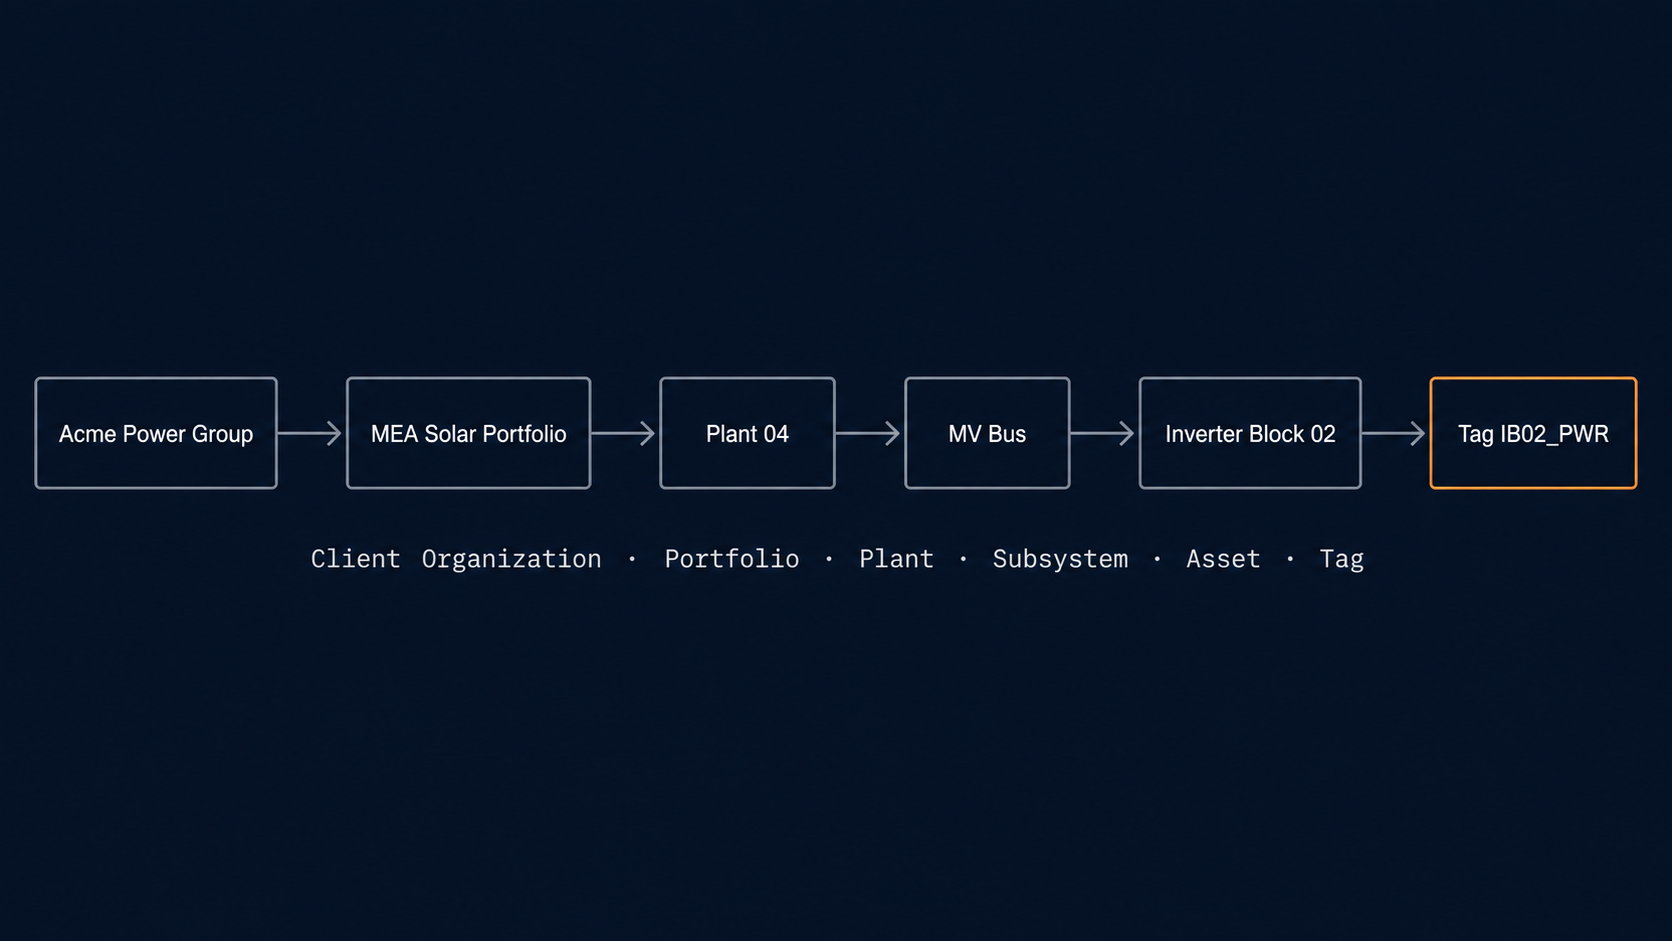
Client Organization → Portfolio → Plant → Subsystem → Asset → Tag / Point / Event
Add a plant under an existing tenant and your portfolio view, your KPIs, your audit trail, and your access control update on the same login. No second instance to provision. No second contract to negotiate.
Add a third-party O&M contractor and they're scoped to specific plants and specific functions inside the customer's tenant — owner sees what owner sees, contractor sees what contractor sees, lender sees what lender sees. Same source.
Vendor-agnostic by architecture
Speak the protocols the field already speaks.
LumeTrax ingests from every major inverter, BESS, switchgear, tracker, met station, and DG controller ecosystem over the protocols those ecosystems publish. We add an ecosystem when the field needs it. We don't sell the integration back as a premium tier.
Implementation runs through a hardened on-site or near-site edge gateway that handles ingestion, local supervisory functions, and offline buffering. The gateway is sized to the deployment in the Core questionnaire — capex'd to the project the way industrial control hardware always has been.
Modbus TCP / RTU · IEC 61850 · SunSpec · MQTT · OPC UA · OEM APIs
Mission-critical control stays deterministic. Always.
The boundary that protects the asset is built into the architecture.
Supervisory control, interlocks, and safety-critical command sequencing live in the OT layer (SCADA, PLC, RTU, on-site controller), where determinism is provable and the failure mode is engineered rather than negotiated. Analytics, workflow, optimization, and assurance run above that boundary, in shared platform services. Useful, valuable, increasingly intelligent. Never the layer protecting the asset.
Adding a feature on the platform side never compromises the deterministic side. New OEM ecosystems are added inside ingestion, not inside control. Network segmentation is real, audited, and enforced. We don't assert it; we run it.
Same definitions across every site
One alarm philosophy. One event taxonomy. One reporting logic. Across the whole portfolio.
Cross-portfolio comparisons only work if every plant computes the same KPIs the same way against the same definitions.
LumeTrax's tenant model enforces that automatically — the PR for Plant 04 is computed by the same logic as the PR for Plant 47. Availability is decomposed by the same attribution categories. Downtime is classified against the same taxonomy. Loss attribution allocates against the same loss buckets.
The result: portfolio-wide rankings that reflect actual performance, not definition drift between sites.
The difference between dashboard and decision
Operating metrics computed to the level a debt covenant was written at.
"Financial-grade" means every operational claim traces back to time-stamped plant data, classified events, documented assumptions, and exportable evidence packs that owners, operators, lenders, and technical advisors review against the same source. It's a methodology constraint as much as a feature.
DSCR-relevant operating metrics
Audit-ready evidence packs
One plant truth, three audiences
- kWh deliveredEnergy delivered against PPA · contracted-vs-actual deviation
- Availability %Availability decomposed by attribution category
- Performance RatioPR vs. weather-normalized expected PR · DSCR-relevant operating metrics
- Outage hoursRecoverable vs. permanent loss · evidence pack per claim window
Where LumeTrax uses intelligence — and where it doesn't
Physics where physics governs. Machine learning where it improves prediction. Human-reviewable logic where lender evidence requires traceability.
Performance analysis in power assets starts with physics, operating context, and source-linked data. We use statistical and machine-learning methods where they measurably improve detection, forecasting, or anomaly classification — not as decoration.
| Application | What it does |
|---|---|
| Forecasting | Production forecasts for day-ahead and week-ahead dispatch and contract management — feeds Optimizer dispatch logic and Vision performance analysis |
| Fault detection & diagnostics (FDD) | Detection of degradation patterns the alarm philosophy doesn't surface — equipment drifting below cohort norms, trackers stuck mid-axis, soiling rates accelerating |
| Anomaly classification | Distinguishes weather variability from equipment degradation from O&M latency in loss attribution |
| Dispatch optimization under volatility | Probabilistic price and demand inputs into hybrid PV+BESS+DG dispatch decisions |
What we don't do: claim agentic operations we haven't shipped, hide model assumptions inside a black box, or use language-model output to populate lender-grade performance fields. Every figure in every Vision report and every Audit & Assurance deliverable is auditable to the underlying historian record, alarm event, or work-order ID it came from. We don't decorate with AI.
Activate what you need today. Add the rest when the asset, contract, or lender asks for it.
One platform. Five capabilities. Module-by-module subscription entitlement.
- Core— Industrial SCADA & plant control. The operational backbone.Explore →
- Asset Manager— Power-plant-native O&M workflow. The accountability layer.Explore →
- Vision— Performance analytics that explain why. The differentiator.Explore →
- Optimizer— Hybrid EMS for PV + BESS + DG. The premium module for revenue-critical hybrid plants.Explore →
- Audit & Assurance— Independent technical reviews. Sold as engagement fees.Explore →
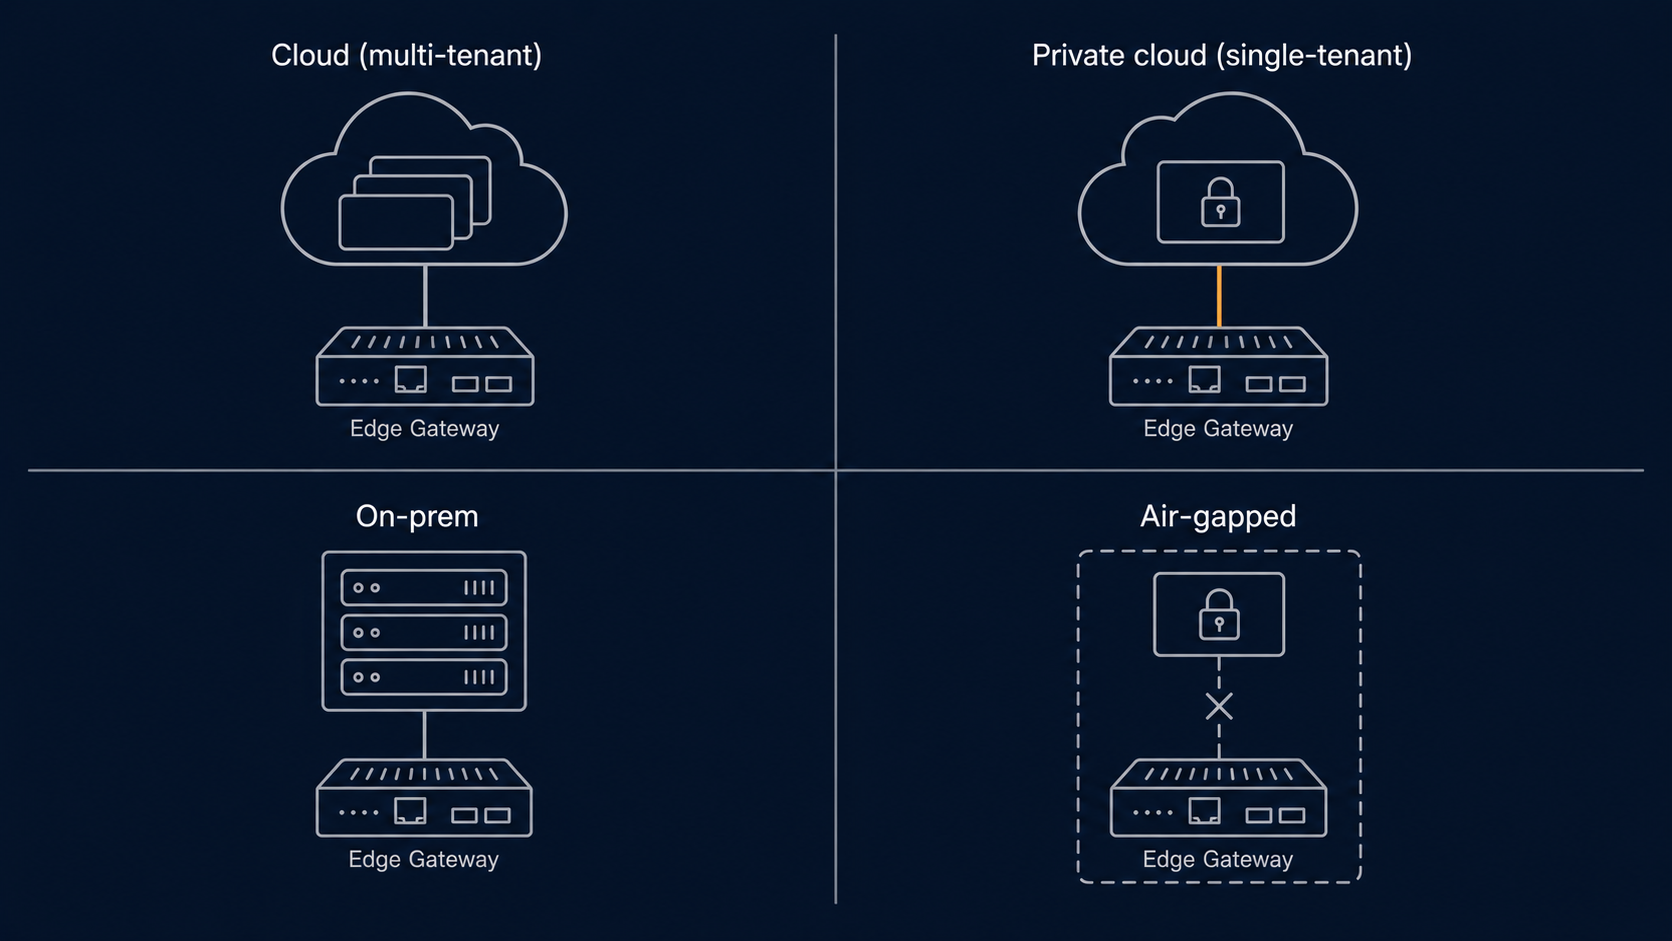
Cloud, private, on-prem, or air-gapped — same software, four shapes.
Deployment models.
Cloud (multi-tenant)
Default deployment. Shared platform services on a managed cloud region.
When to use itMost asset owners and operators. Fastest to deploy, fastest to update.
Private cloud (single-tenant)
Isolated cloud deployment per customer organisation. Same operations team, separate data and infrastructure.
When to use itCustomers with internal security policies that require single-tenancy or specific cloud-region pinning.
On-prem
Customer-controlled deployment in customer or partner datacentre.
When to use itRegulators or contracts requiring data and compute under customer control.
Air-gapped
On-prem with no inbound or outbound platform connectivity.
When to use itRestricted-network or sovereign-control projects. Ingestion and operations work entirely inside the customer perimeter.
The deployment shape is decided in the Core questionnaire. Subsequent shape changes (e.g. cloud → private) are supported as commercial requirements evolve.
Architecture review
Ready to see the platform against your portfolio?
30-minute scoping call. We map your assets to the architecture, then run through the modules that match.