Performance analytics
Stop describing performance. Start explaining it.
Performance Ratio, availability, specific yield, loss attribution, fault detection, soiling, forecasting, cross-site benchmarking — physics-aware, source-linked, lender-ready. LumeTrax® Vision answers why, not just what.
Built so the answer to "why is PR off this month?" takes minutes, not a Monday-morning meeting.
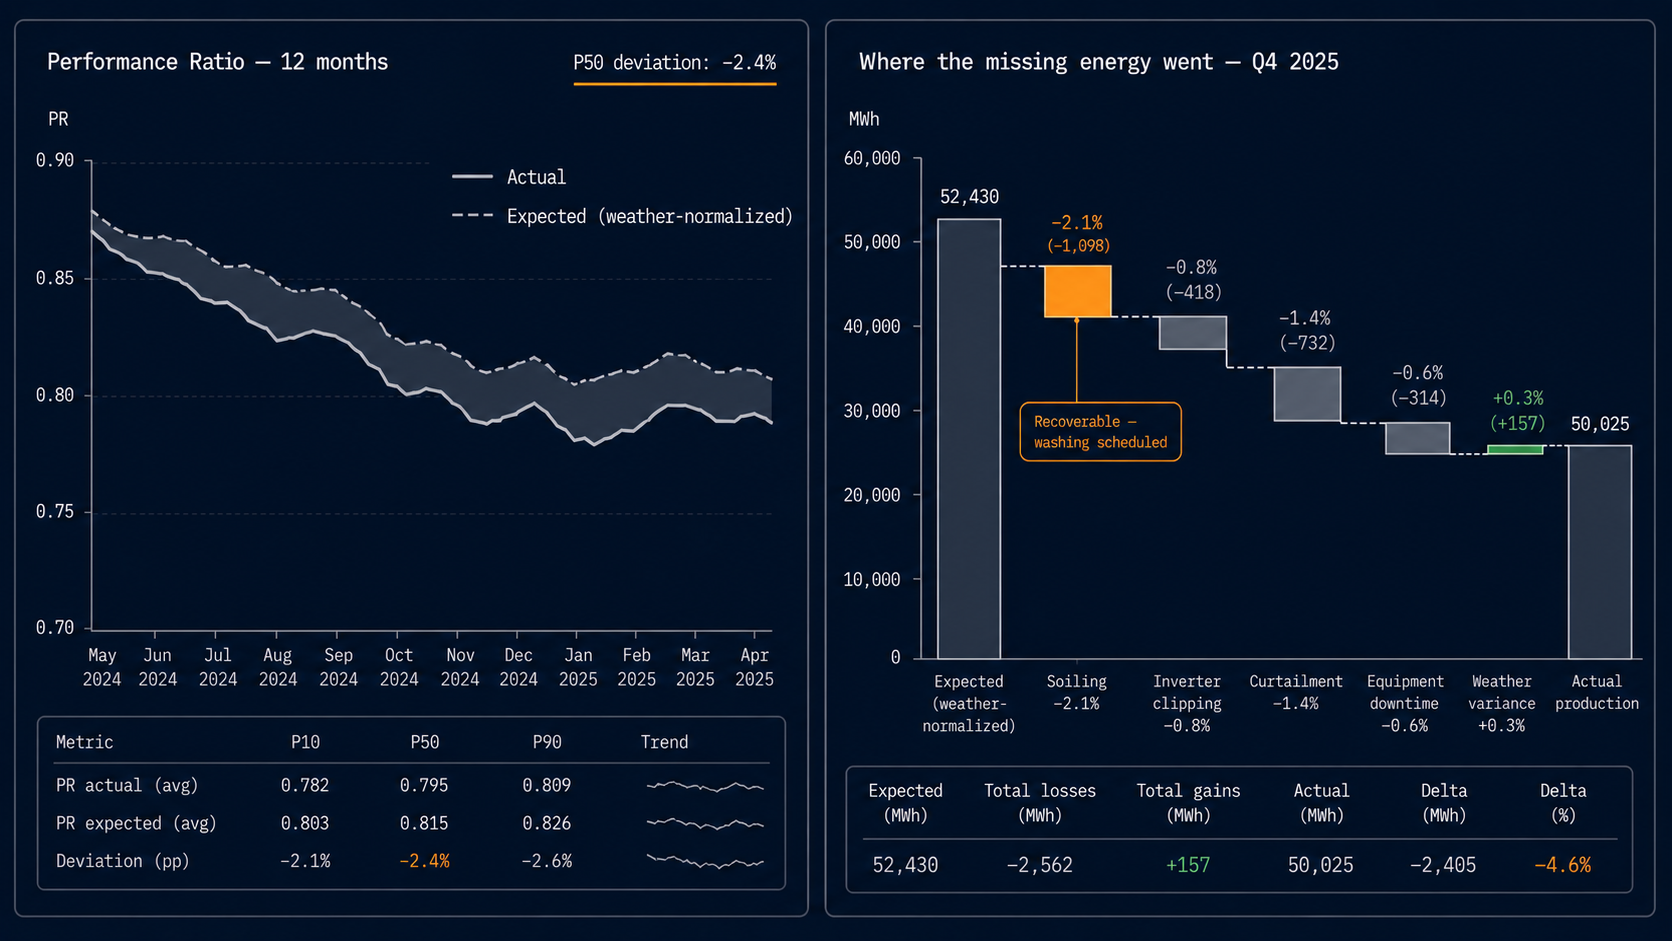
Vision is built around one question: where did the missing megawatt-hours go?
A standard portal tells you the plant produced 38.2 MWh yesterday. That's a description. It doesn't tell you whether 38.2 was good, what the plant should have produced under the irradiance and ambient conditions that actually happened, or which of the missing megawatt-hours are recoverable.
Vision starts there. Weather-normalized expected output. Loss-attributed actual output. Variance broken down by cause: soiling, shading, inverter clipping, curtailment, equipment downtime, weather, anomaly. The output is the diagnosis, not the symptom.
The KPIs the contract was actually written against
PR, availability, specific yield, capacity factor — to lender-grade definitions, not vendor-portal defaults.
Performance Ratio (PR)
Availability
Specific yield + capacity factor
The line on the report that the lender reads first
Where did the missing megawatt-hours go? Per cause. Per asset. Per minute.
Every gap between expected and actual production is decomposed into named loss categories — soiling, shading, inverter clipping, MV/HV losses, curtailment, downtime (by attribution sub-category), tracker errors, anomaly. The decomposition is auditable to source — each loss bucket links back to the historian, the alarm event, or the operational record that generated it.
The decision the report enables: which losses are recoverable through O&M action, which are claimable from a counterparty, which are physics. The first two get tickets in Asset Manager. The third gets accepted and recorded.
Catch the silent failures
Anomaly detection on equipment that hasn't tripped — yet.
Some failures announce themselves with an alarm. Others degrade quietly — an inverter operating at 96% of its peer cohort for six weeks, a tracker drifting half a degree, a string under-producing relative to its neighbours, a transformer running hotter than its peer cohort under similar load. Vision watches for those drifts, classifies them by likely cause, and routes the diagnosis to the operator and to Asset Manager. The work order opens before the failure does.
FDD models are scoped to specific failure modes — they're not a generic anomaly detector. Each model has documented inputs, documented thresholds, and a documented confidence level. When a customer or auditor asks "what triggered this alert and how confident are you?", the answer is one click into the methodology page.
Physics-aware models, not generic feature pipelines
Built on the physics of the asset class — not on a generic anomaly detector.
Soiling estimation
Production forecasting
Weather normalization
The portfolio view your asset manager will use
Which plant in the portfolio is underperforming — and against what?
Vision benchmarks every plant in a portfolio against its weather-normalized expected output, against the portfolio median, and against peer plants of similar configuration and climate. The output is a ranked view: which sites are over-performing (and why), which are under (and what's recoverable). The white-space between the best and worst plants in a portfolio is usually the first place a yield-improvement program should run.
Cross-portfolio benchmarking against other customers' plants is opt-in and anonymised per the data-neutrality policy on /security. LumeTrax never shares plant-level data across tenants without written customer authorisation.
Why the lender takes the report seriously
Every figure in every Vision report is auditable to source.
Lender-grade analytics requires more than good numbers. It requires methodology that's documented, repeatable, and reviewable.
- Definitions— PR, availability, capacity factor, yield, loss buckets — each defined unambiguously, version-controlled.
- Data inputs— Historian fields used, weather sources, irradiance correction, temperature derating, sampling cadence.
- Calculation logic— The formula behind every aggregated metric, with worked examples.
- Confidence and exclusions— When data is insufficient or contested, the methodology says so — claims are not extrapolated past their support.
- Source-linked outputs— Every figure in the report is one click from the underlying historian record, alarm event, or work-order ID.
When two consecutive periods produce directly comparable numbers, that comparability is a methodology property — not a coincidence. When the lender's IE asks "show me how this PR was computed," the answer is the methodology page plus the source links.
Lender-grade output
The deliverable a lender or investor actually opens.
Vision's quarterly performance report is built to land on a desk that's also reading audited financials. Source-linked figures. Defined methodology. Repeatable structure. No vendor-portal screenshots, no 'best effort' availability numbers.
Disciplined ML, source-linked traceability
Physics where physics governs. Machine learning where it improves prediction. Human-reviewable logic where lender evidence requires traceability.
Performance analysis in power assets starts with physics, operating context, and source-linked data. We use statistical and machine-learning methods where they measurably improve detection, forecasting, or anomaly classification — not as decoration.
| Application | What it does |
|---|---|
| Forecasting | Production forecasts for day-ahead and week-ahead dispatch and contract management |
| Fault detection & diagnostics (FDD) | Detection of degradation patterns the alarm philosophy doesn't surface |
| Anomaly classification | Distinguishes weather variability from equipment degradation from O&M latency in loss attribution |
| Dispatch optimization under volatility | Probabilistic price and demand inputs into hybrid PV+BESS+DG dispatch decisions (in Optimizer) |
What we don't do: claim agentic operations we haven't shipped, hide model assumptions inside a black box, or use language-model output to populate lender-grade performance fields. We don't decorate with AI.
Pricing
Indicative starting points.
| Tier | Starting price | Suited for |
|---|---|---|
| Insight | from $900 / mo | Single-plant or small-portfolio analytics. Standard PR / availability / specific yield, FDD, monthly performance reports. |
| Predict | from $2,400 / mo | Multi-plant analytics with full loss attribution, soiling-loss-rate analysis, forecasting, cross-site benchmarking, lender-grade reporting templates. |
| Enterprise | quotation | Portfolio-scale analytics, custom KPI definitions, custom report templates, advanced anomaly models, regulated reporting cadences. |
Indicative starting points only. Final pricing depends on plant count, KPI scope, reporting cadence, and integration scope.
Frequently asked questions
- Yes. Vision reads from Core directly when both are deployed, and via standard ingestion (historian export, OPC UA, MQTT, OEM APIs) when Core is not. Output quality depends on data resolution and signal coverage — surfaced in the questionnaire.
- Vision's methodology is documented and auditable to source. Lender acceptance is a function of the lender, the contract, and the documentation provided — but the deliverable is built to that bar, not below it. Sample report available on request.
- Each loss-bucket allocation is auditable to the underlying historian record, alarm event, or operational entry. The methodology document defines the allocation logic per category. Discrepancies between Vision's allocation and an operator's interpretation are reconcilable to the source data — that is the point.
- Day-ahead and week-ahead forecasts are produced. For real-time dispatch in hybrid PV+BESS+DG plants, Optimizer is the relevant module — Vision provides the forecast inputs Optimizer dispatches against.
- Cross-portfolio benchmarking is opt-in and anonymised under the data-neutrality policy on /security. LumeTrax never shares plant-level data across tenants without written customer authorisation. Customers can compare against industry-anonymised aggregates without exposing their plants — or opt out entirely.
Vision diagnoses. Optimizer acts. Audit & Assurance verifies.